 |  |
phone: +7 495 1087345 fax: +7 495 1087345 office@trans-service.org |
 |  |  |
 |
 |


Diesel Diagnosis Systems (DDS)
Overview:
Monitoring System Hardware:
System Use:
Back to "Diesel Diagnosis Systems (DDS)"
Monitoring Modes
1. Engine Protection (Background) Mode
2. Main Engine Mode
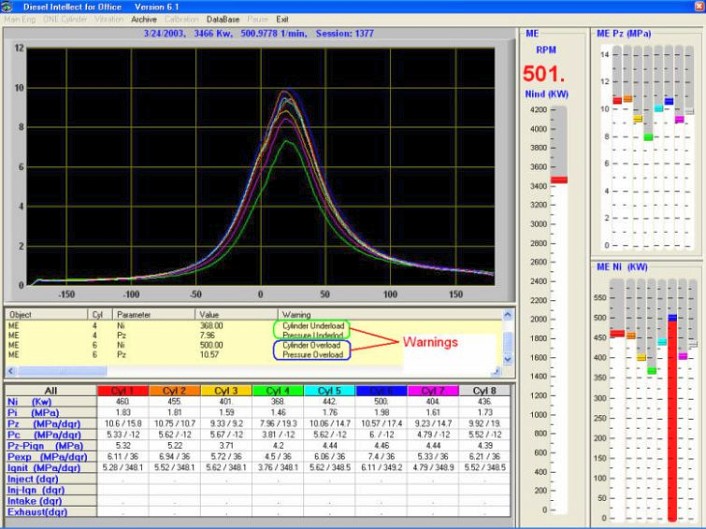
Figure 6.1
3. One Cylinder Mode
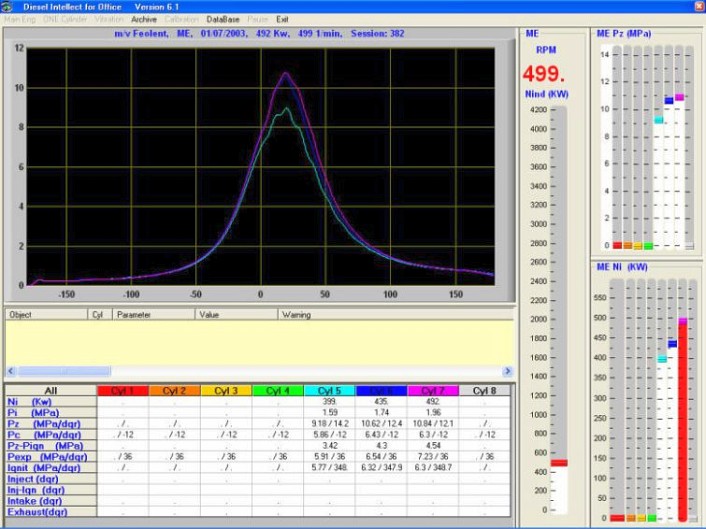
Figure 6.2
4. Vibration
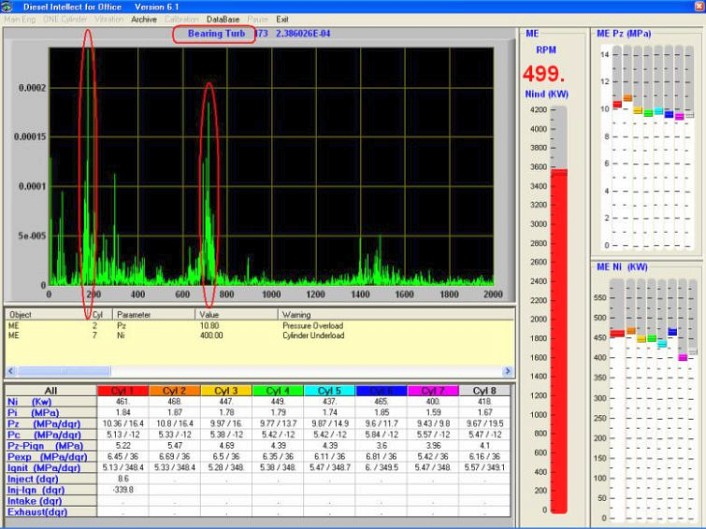
Figure 6.3
5. Archive Mode
6. Track Mode
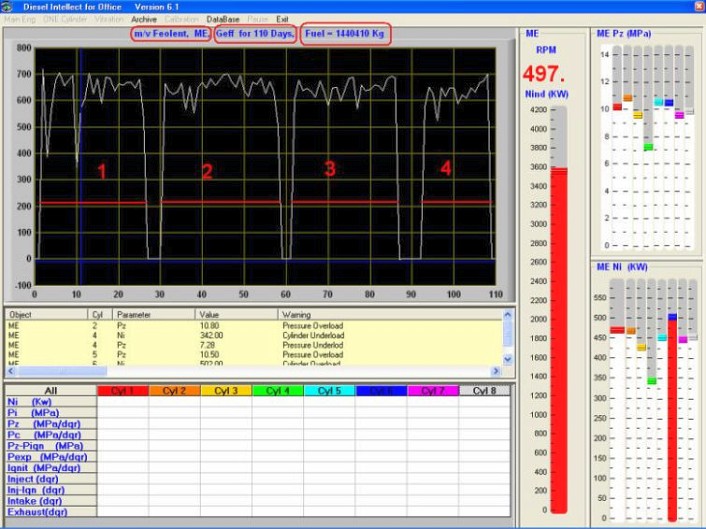
Figure 6.4
7. Calibration
8. Database
General Information: